Automatic 3D+t four-chamber CMR quantification of the UK biobank: integrating imaging and non-imaging data priors at scale
Highlights
- New Multi-Cue Shape Inference Network (MCSI-Net) that uses multi-view image data as well as non-imaging demographic data to predict 3D cardiac shapes of all four cardiac chambers;
- Experiments to show that integrating multi-view and multi-modal data allows the network to accurately reconstruct 3D cardiac shapes with less image data (1/2 to only 1/4 of the slices), which could speed-up CMR scan acquisitions.
Introductions
The goal of the authors is to have a method that can accurately predict a high-resolution 3D shape of the heart from a collection of 2D and 3D views as well as non-imaging data. Simply segmenting the 3D Short-AXIS (SAX) view would not work for them, since the distance between axial slices (of which there are typically 7 to 15) is too big.
Data
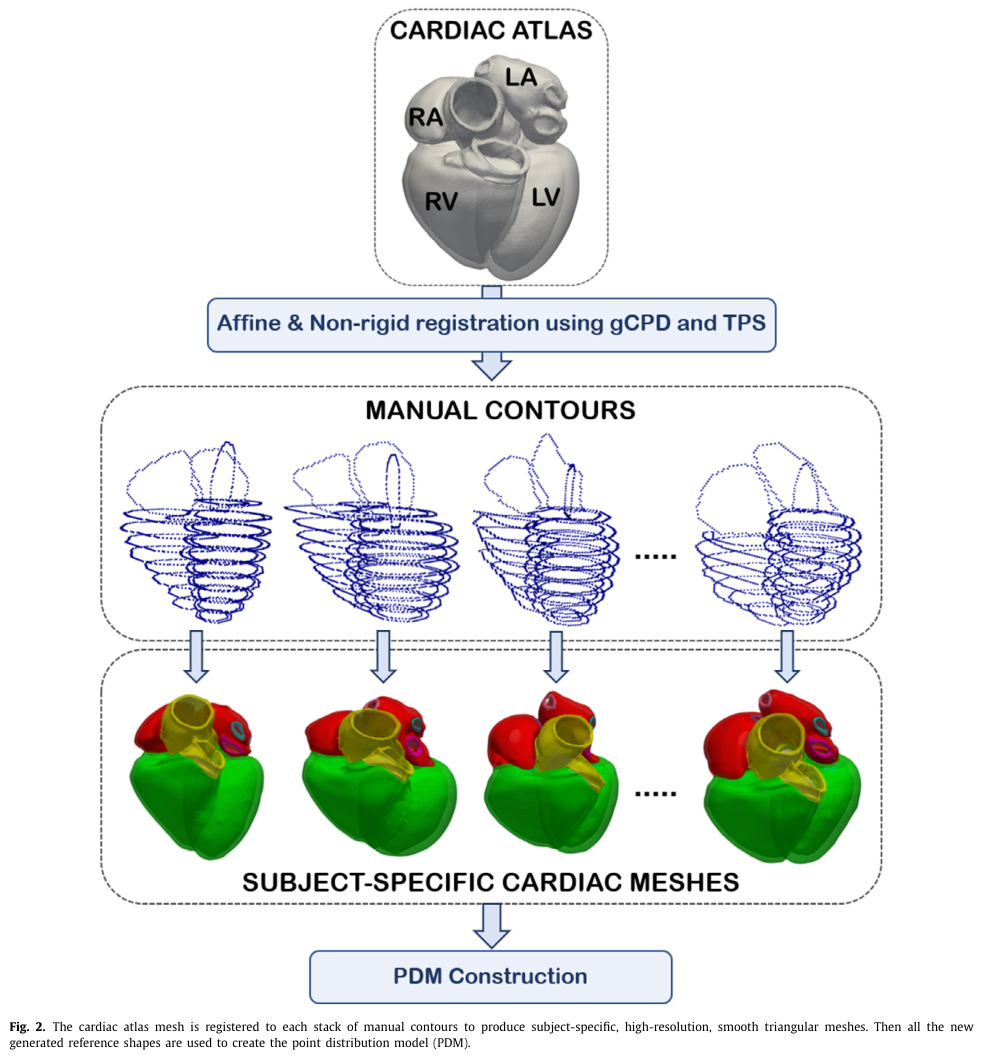
The authors use the Cardiac Magnetic Resonance (CMR) data of a cohort of 4525 patients from the UK Biobank (UKB) for which contours were manually annotated by experts. These manual contour annotations were used as reference points to register a high-resolution 3D shape atlas1 to each volume, to obtain an accurate 3D volume for each patient. The registration is done in two steps: i) a global affine registration, and ii) a region-based non-rigid registration, where each region corresponds to one of the structures to segment.
To note that the paper goes into quite a bit of detail to justify the choice of registration algorithm.
For the non-imaging variables, they were all normalized in the range \([0,1]\), including categorical variables which were first grouped by class.
Methods
The authors propose their Multi-Cue Shape Inference Network (MCSI-Net), composed of two sub-networks, to predict two outputs: i) the first k (in their case 70) PCA components of a normalized, centralized 3D shape, and ii) the parameters of the affine transformation to obtain the final 3D shape from the first output. The architecture of MCSI-Net is illustrated in the figure below:

From the first output of MCSI-Net (the PCA components), the authors reconstruct the 3D shape using a linear generative model and mean and covariance statistics computed on the shapes in the training set.
To train both sub-networks, the authors use L2 losses to regress the PCA components/transformation parameters (but they use the geodesic distance for the rotation parameters).
Results
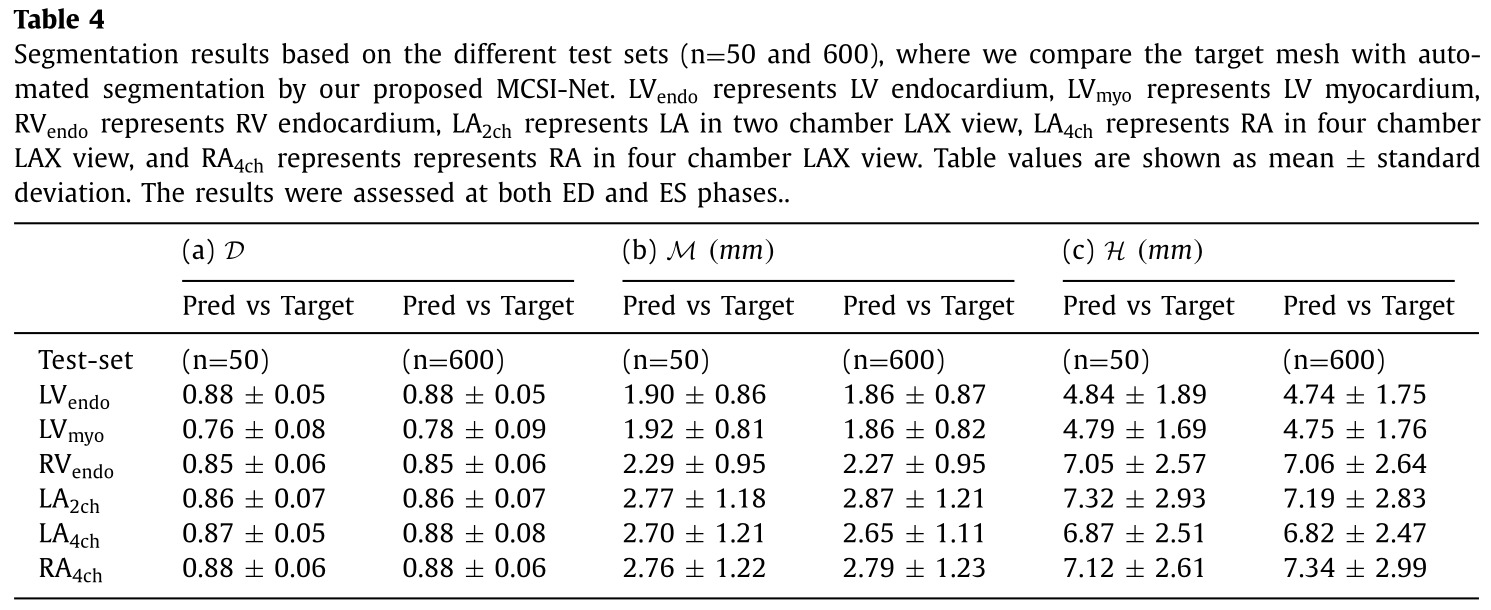
The authors mention that they compared themselves to another SOTA method from Bai et al., but no table clearly compares the performance of their method to Bai’s one. Similarly, the authors also measured inter-expert variability on a subset of the testing set (50 patients), but they only compare their performance to the inter-expert variability on clinical indices derived from the volumes. I assume this is because the comparison would not be fair, since the manual contours were done slice-by-slice, and thus have less inter-slice coherence then the proposed method.
Because of this, I present below only the most relevant and informative results in my opinion.

Ablation studies
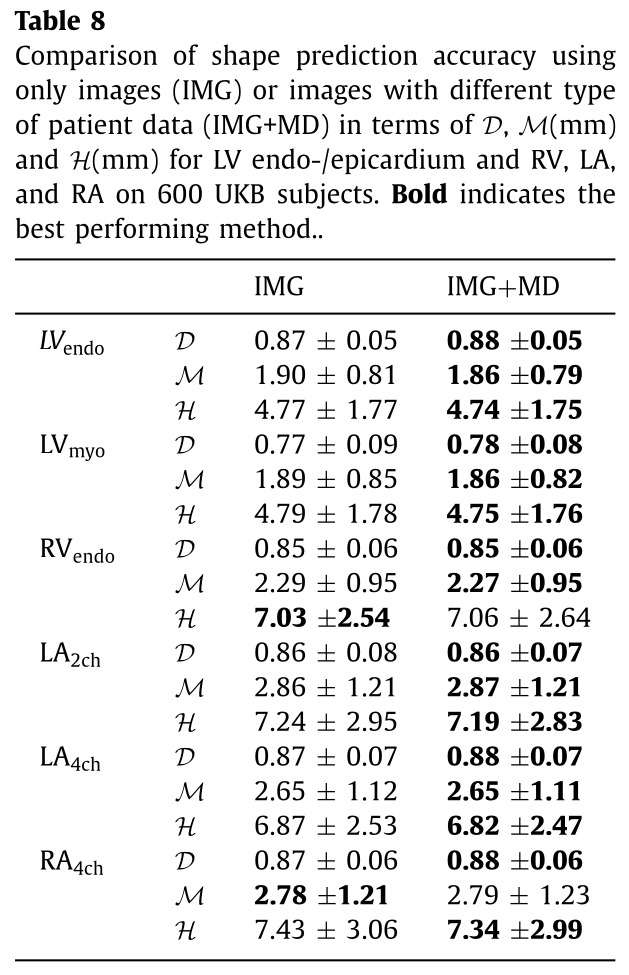
Non-imaging data
The authors performed an ablation study that show that adding non-imaging data helps, but only very slightly.
Missing imaging views
Finally, they also test if their model can still predict accurate reconstructions with some views missing in input. To this end, they train different models on various combinations of data: only base, mid and apex (BMA) SAX images, only full stack of SAX images, only LAX images, BMA+LAX images, and finally all SAX+LAX images (normal).
The full results are too detailed to show here, but overall the model performs best with all SAX and LAX images. The performance deteriorate gradually with only LAX and BMA images, and they are significantly worse with only LAX images.
Remarks
- The paper overall is not well constructed; the main idea is relatively simple, but not declared clearly enough early on. Because of this, I sometimes lost track of their ultimate goal amongst all the implementation details.