Representation learning for improved interpretability and classification accuracy of clinical factors from EEG
 Figure 1 : The overall system.
Introduction
The authors propose a modeling tool to improve interpretability and classification of mental health disorders, in particular depression. This is done based on eeg (electroencephalography) signals. This is challenging as diagnosis is hard with low consistency between expert and no fixed symptom profile.
The goal is for the system to extract relevant interpretable biomarkers with as little data as possible. Also, learning should not be tied to diasnostic criteria since reliability is low and somehow subjective.
Proposed approach
They focus their study on a core symptom of depression : anhedonia (the inability to feel pleasure). From a cohort of 758 people with normal controls and subjects suffering from a mental illness, they show these people a series of \(80\) neutral and positive images and recorded their EEG with 3 electrodes. These positive and neutral EEGs are then averaged so each patient is assigned 6 signals : 3 electrodes x 2 types of stimulus. All in all, this results into a \(256\times 6\) tensor that will later on be fed to a VAE.
The idea here is for the red and blue curves (neutral vs positive images) to be different for normal control but indistinguishable for subjects suffering from a mental disorder.
 Following the previous image, they first train a beta-VAE to learn a disentangled latent representation of a \(256\times 6\) tensor with the following loss:

The beta-VAE encoder and decoder have 2 conv layers and a 10D latent space.
Then, following the overall system illustrated in figure 1, they freeze the beta-VAE and train a so-called SCAN (Symbol–Concept Association Network) VAE [1] whose goal consist in encoding a 5-hot binary classification labels \(y\) with the following loss to make sure the SCAN latent space is the same than that of the beta-VAE:

The output of the SCAN VAE is a per-class softmax.
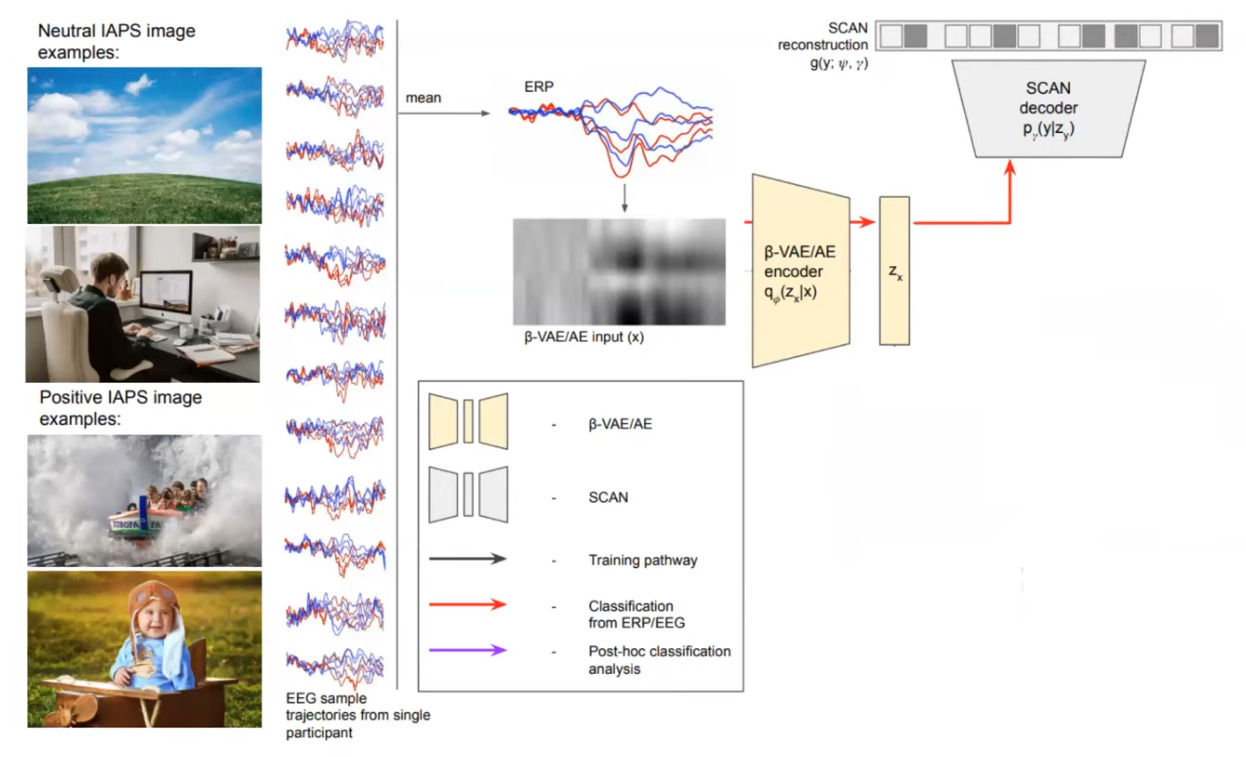
To obtain classification, an EEG signal is presented to the beta-VAE encoder and the inferred \(z_x\) mean is fed to the SCAN decoder, where a softmax is applied to obtain the predicted label (c.f. red pathway).
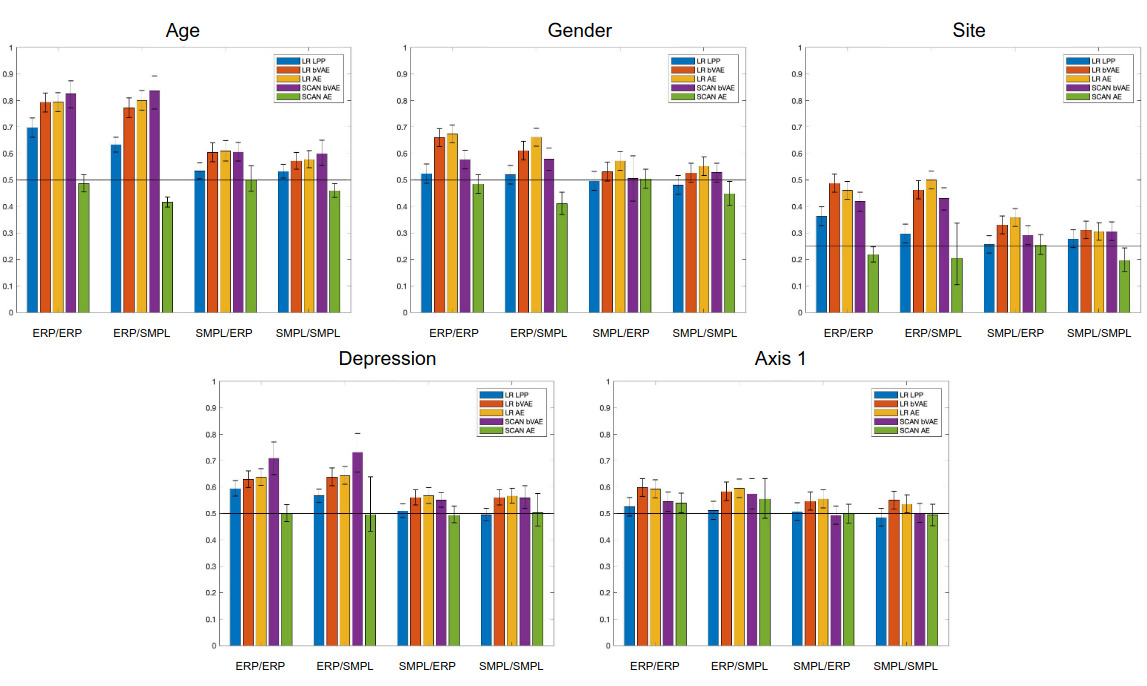
As shown in the previous graph, they report better results than other approaches commonly used.

One very appealing feature is to use the SCAN encoder and visualize the latent space. They show that thanks to the disantangling capabilities of the beta-VAE, only 1 dimension is responsible for depression.

Then, by using the beta-VAE decoder, we see that the system is capable of reproducing EEG signals that are typical of normal controls and people with mental disorder.
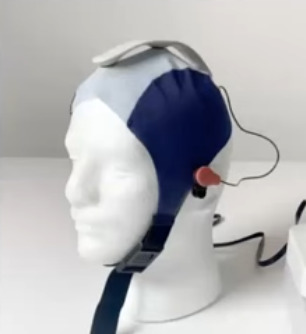
Below is their EEG helmet.
References
For more information, you may want to watch the following two videos
[1] Irina Higgins, Nicolas Sonnerat, Loic Matthey, Arka Pal, Christopher P Burgess, Matko Bošnjak, Murray Shanahan, Matthew Botvinick, Demis Hassabis, Alexander Lerchner SCAN: LEARNING HIERARCHICAL COMPOSITIONAL VISUAL CONCEPTS, ICLR 2018