Fréchet Radiomic Distance (FRD): A Versatile Metric for Comparing Medical Imaging Datasets
Highlights
- The authors introduce FRD (Fréchet Radiomic Distance), a new task-independent perceptual metric specifically designed for medical images, based on standardized, interpretable radiomic features rather than learned deep features.
- FRD consistently outperforms FID, RadFID, KID, and CMMD across out-of-distribution detection, image-to-image translation evaluation, unconditional generation evaluation, and abnormality detection.
- FRD is stable at small sample sizes (down to \(N \approx 10\)), sensitive to image corruptions and adversarial attacks, and correlates with radiologist perception of image quality.
- Links to the code: frd-score and evaluation framework
Motivations
Comparing image distributions is central to modern medical image analysis. Common use cases include:
- Out-of-distribution (OOD) detection: detecting when new images come from a different scanner, protocol, or site than the training data.
- Evaluating image-to-image translation: assessing whether translated images (e.g., MRI→CT) are realistic and preserve anatomical structures.
- Evaluating generative models: measuring the quality and diversity of synthetic medical images.
The standard metric for these tasks in computer vision is FID (Fréchet Inception Distance) 1, which encodes images through an ImageNet-pretrained Inception v3 network and computes the Fréchet distance between the resulting feature distributions. However, FID has fundamental problems for medical images:
- Meaningless features: ImageNet features capture “natural image” semantics (dogs, cats, cars), not anatomical structures or tissue textures relevant to medicine.
- Unstable at small \(N\): Medical datasets are typically far smaller than the \(10^4\)–\(10^5\) samples FID requires for reliable estimates.
- Poor correlation with downstream tasks: A lower FID does not reliably predict better segmentation or classification performance on medical data.
The Fréchet Distance
Before diving into FRD, let us briefly recall how distribution comparison metrics work. Given two image datasets \(D_1\) and \(D_2\), each image is encoded into a feature vector of dimension \(m\) via an encoder \(f(x): \mathbb{R}^n \rightarrow \mathbb{R}^m\), where \(n\) is the number of pixels per image and \(m\) is the number of extracted features. This produces two sets of feature vectors \(F_1, F_2 \subset \mathbb{R}^m\). Assuming the feature distributions are Gaussian with estimated mean vectors \(\mu_1, \mu_2\) and covariance matrices \(\Sigma_1, \Sigma_2\), the Fréchet distance 2 between them is:
\[d_F(F_1, F_2) = \left( \|\mu_1 - \mu_2\|_2^2 + \text{tr}\left[\Sigma_1 + \Sigma_2 - 2(\Sigma_1 \Sigma_2)^{1/2}\right] \right)^{1/2}\]Different metrics use different encoders:
- FID 1: ImageNet-pretrained Inception v3 (\(m \approx 2048\)) — features learned from natural images
- RadFID: RadImageNet-pretrained encoder — features learned from medical images, but still opaque and difficult to interpret
- KID 3: Also Inception-based, uses MMD instead of Fréchet distance
- CMMD: CLIP-extracted features with MMD
All existing metrics rely on learned features that lack clinical interpretability except for RadFID. FRD replaces them with standardized radiomic features.
Method
Radiomic Features
Radiomics refers to the extraction of quantitative features from medical images. These are hand-crafted, standardized, and clinically meaningful descriptors that have been widely used in medical image analysis for cancer screening, outcome prediction, and treatment response assessment 4 5. These features are in compliance with the Imaging Biomarker Standardization Initiative, ensuring standardization and reproducibility.
The authors previously proposed a preliminary version, FRD\(_{v0}\), which extracted 94 radiomic features with min-max normalization. FRD improves upon this in three key ways:
-
Wavelet/Fourier filtering: Before extracting radiomics, images are passed through various optional wavelet filters — a spatial Fourier transform followed by one of four low/high-pass filter combinations (LL, LH, HL, HH). This expands the feature space from 94 to 464 features, capturing frequency-domain differences that reveal subtle distribution shifts.
-
Z-score normalization instead of min-max, providing better robustness to outliers.
-
Joint normalization: Both \(D_1\) and \(D_2\) are normalized with respect to the same reference distribution (\(D_1\)), ensuring consistent feature scaling.
The final FRD formula applies a logarithmic transformation for stability:
\[\text{FRD}(D_1, D_2) := \log \, d_F(f_{\text{radio}}(D_1), f_{\text{radio}}(D_2))\]where \(f_{\text{radio}}(x) \in \mathbb{R}^{464}\) maps each image to its radiomic feature representation. All computations use the PyRadiomics library.
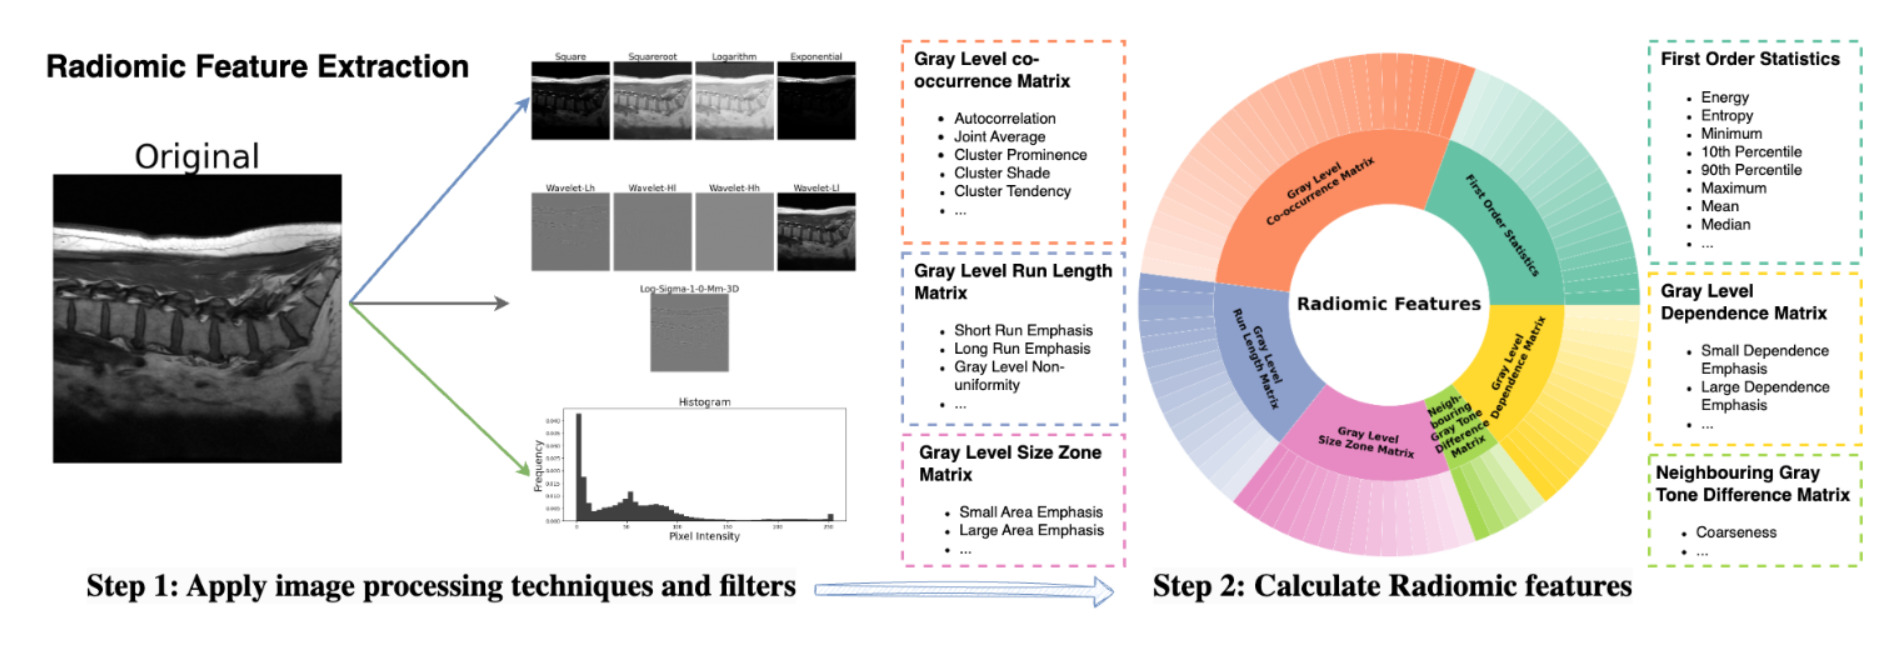
Extraction process and taxonomy for radiomic image features. Step 1: optional wavelet/frequency-space filtering. Step 2: computing various first-order and higher-order features.
Evaluation Framework & Results
The paper proposes a systematic evaluation framework, tested across 4 multi-domain medical datasets covering inter-scanner (breast MRI), inter-sequence (brain MRI T1→T2), and inter-modality (lumbar spine MRI→CT, abdominal CT→MRI) domain shifts. The 7 evaluation axes are :
- Alignment with downstream task metrics and anatomical consistency
- Out-of-Distribution detection ability
- Alignment with radiologist preferences of image quality
- Computational stability and efficiency
- Sensitivity to performance-affecting image corruptions
- Ability to detect adversarial attacks
- Enhanced interpretability for clinical use
OOD Detection
A perceptual metric can detect whether a new image \(x_{\text{test}}\) is in-distribution (ID) or out-of-distribution (OOD) by measuring its distance from a reference ID dataset. The OOD score \(s\) is defined as the distance (here, they use L2) of \(x_{test}\)’s features from the mean features of \(D_{ID}\) :
\[s(x_{\text{test}}; D_{\text{ID}}) = \|f(x_{\text{test}}) - \mathbb{E}_{x_{\text{ID}} \sim D_{\text{ID}}} f(x_{\text{ID}})\|_2\]FRD achieves the best average AUC of 0.94 across all 4 datasets, with particularly strong performance on the challenging case of breast MRI inter-scanner shift, where domain differences are visually subtle.
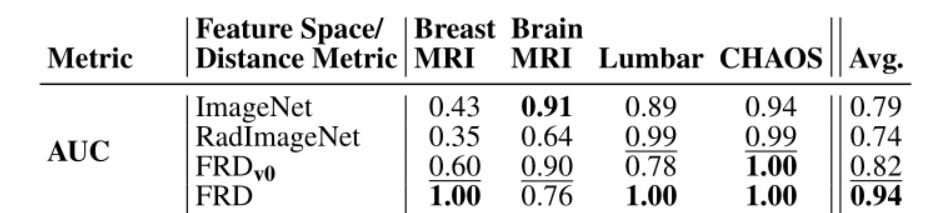
OOD detection results using different feature spaces. FRD achieves the best average AUC (0.94)
Evaluating Image-to-Image Translation
The authors conduct a study of generative models for medical image translation, evaluating 6 state-of-the-art unpaired models (CycleGAN, MUNIT, CUT, GcGAN, MaskGAN, UNSB) across all 4 datasets.
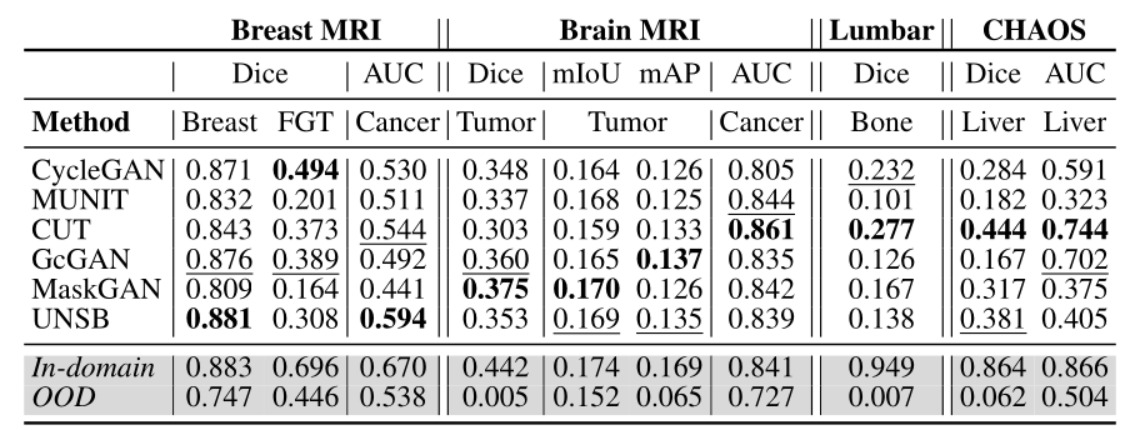
Performance on downstream task for different datasets
The question they try to answer is : does a lower perceptual metric actually predict better downstream task performance? The authors compute the Pearson correlation \(r\) between each metric and downstream task performance for different datasets (segmentation Dice, detection mAP, classification AUC) across all translation models.
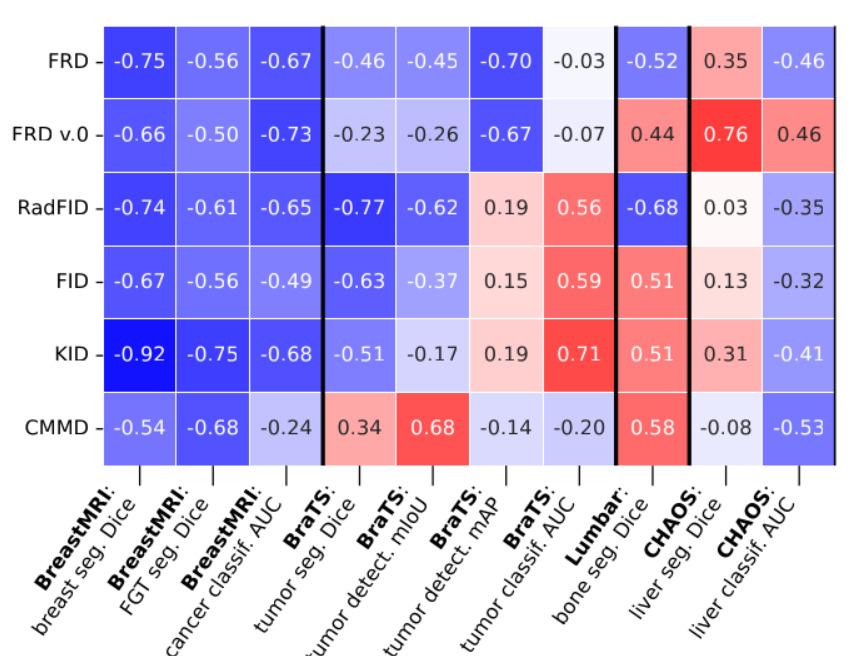
Pearson correlation of perceptual metrics (vertical axis) with downstream task-based metrics (horizontal axis). Lower r (colder color) is better — FRD has the strongest (most negative) average correlation.
FRD has the strongest average correlation with downstream task performance (\(r = -0.43\)), followed by RadFID (\(r = -0.36\)). FID, KID, and CMMD are much less consistent.
Alignment with Radiologist Perception
In a reader study with 3 experienced radiologists (two breast radiologists and a surgical oncologist), readers rated the realism of 90 synthetic mammography images on a Likert scale from 1 (extremely confident the scan is fake) to 6 (extremely confident the scan is real).
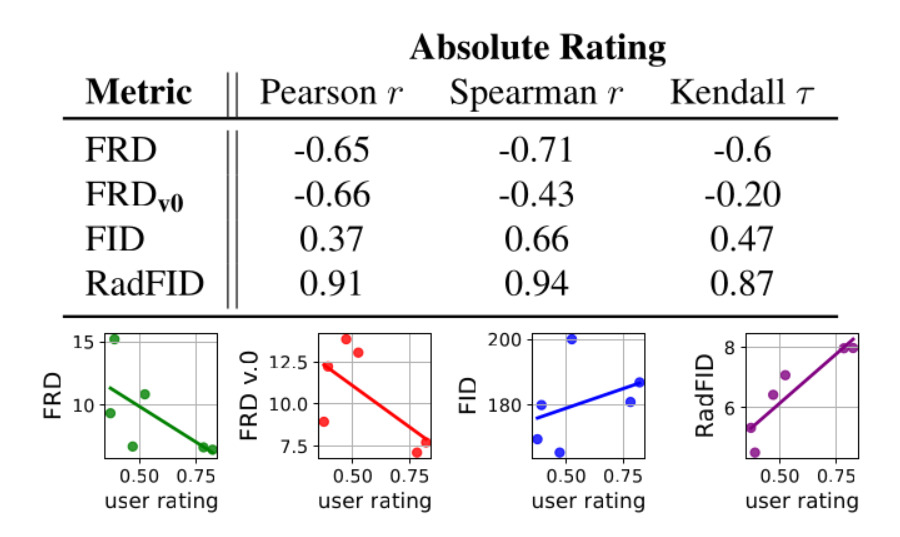
Correlation of distance metrics with average user (radiologist) preference. FRD shows the expected negative correlation (lower distance = more realistic), while FID and RadFID anti-correlate.
FRD negatively correlates with user ratings as expected : lower metric distance corresponds to images rated as more realistic. FID and RadFID positively correlate, meaning they consider less realistic images to be closer to real distributions. This is a strong result but this behavior (the positive correlation) is likely an artifact of the very small sample size used in the reader study (\(N=90\)), a low-data regime where FID and RadFID are known to completely break down, further highlighting why FRD’s robustness is essential for clinical evaluations.
Key Properties of FRD
Small-Sample Stability
Medical datasets are orders of magnitude smaller than natural image datasets (\(N \approx 10^2\)–\(10^4\) vs. \(10^6\) for ImageNet). FID generally requires \(N \approx 10^4\)–\(10^5\) samples for stable estimates, which is prohibitive in many medical imaging settings.
The authors evaluate metric stability by computing each metric at varying sample sizes \(N\) for image translation evaluation. FRD remains stable even for very small \(N\) (down to \(N = 10\)), while RadFID and FID, as well as FRD\(_{v0}\) to a lesser extent, diverge as \(N\) shrinks across all datasets.
Why? Computing the Fréchet distance requires estimating covariance matrices \(\Sigma_1, \Sigma_2 \in \mathbb{R}^{m \times m}\), which becomes unreliable when \(N \ll m\). FRD has two advantages here: first, it operates in a smaller feature space (\(m = 464\)) than FID (\(m \approx 2048\)). Second, FRD’s radiomic features are highly correlated, meaning the covariance matrices are approximately low-rank and can be reliably estimated even with very few samples. FID’s learned features are more independent, so their covariance matrices truly require thousands of samples to estimate well.
FRD is also faster to compute than FID/RadFID for small-to-moderate sample sizes (\(N \lesssim 500\)), as it avoids neural network forward passes.
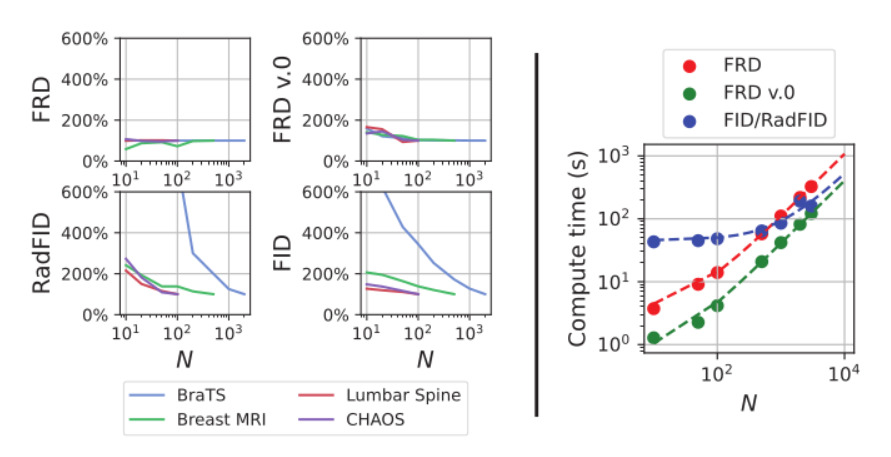
Left: Sensitivity of FRD, FRDv0, RadFID, and FID to sample size N. FRD remains flat while others diverge at small N. Right: Computation time — FRD is faster for small N.
Sensitivity to Image Corruptions
A good metric should react to image corruptions (blur, sharpness changes) proportionally to their effect on downstream task performance. The authors apply Gaussian blur and sharpness adjustments to translated images and measure both the metric change and the downstream performance change. FRD’s sensitivity aligns best with downstream performance sensitivity across datasets, while other metrics are either over-sensitive or under-sensitive.
Sensitivity to Adversarial Attacks
An adversarial attack consists in applying small, targeted perturbations to an input image in order to fool a trained classifier into making incorrect predictions — while the modifications remain visually imperceptible to humans. In safety-critical medical imaging, detecting such attacks is important.
The authors use the FGSM method to generate adversarial examples: given an input image \(x\) with true label \(y\) and a trained classifier \(f\), FGSM computes the adversarial image as \(\tilde{x} = x + \epsilon \, \text{sign}\left(\frac{\partial L(f(x), y)}{\partial x}\right)\), where \(L\) is the loss and \(\epsilon\) controls the attack strength. They then measure whether each metric can distinguish attacked images from clean ones.
FRD clearly differentiates attacked images from clean ones, and its distance increases with attack severity. FRD is typically more sensitive to the most subtle attacks (\(\epsilon = 1/255\)) compared to all other metrics. This highlights a structural blind spot in FID and RadFID: their deep convolutional networks tend to spatially pool and smooth over imperceptible pixel-level noise, whereas FRD’s wavelet and frequency-domain filters explicitly capture these adversarial high-frequency perturbations.
Interpretability
Perhaps FRD’s most distinctive advantage is clinical interpretability. Because each radiomic feature has a known, standardized definition, we can directly analyze what changed between two image distributions.
Consider two sets of images: the source images \(\{x_s\}\) and the translated images \(\{x_{s \rightarrow t}\}\). Each image is mapped to a radiomic feature vector \(h_s = f_{\text{radio}}(x_s) \in \mathbb{R}^{464}\) (resp. \(h_{s \rightarrow t} = f_{\text{radio}}(x_{s \rightarrow t})\)). We can then compute the mean feature vectors over each set: \(\mu_s = \mathbb{E}[h_s]\) and \(\mu_{s \rightarrow t} = \mathbb{E}[h_{s \rightarrow t}]\). The feature change vector is simply their difference:
\[\Delta h := \mu_{s \rightarrow t} - \mu_s \in \mathbb{R}^{464}\]Each component \(\Delta h^i\) tells us how much the \(i\)-th radiomic feature changed on average through the translation. Since every radiomic feature has a known name and definition (e.g., “GLCM Contrast”, “wavelet-LH GLSZM SmallAreaEmphasis”), this vector is directly interpretable. The authors illustrate this by interpreting a CUT model trained for lumbar spine MRI→CT translation:
1. Which features changed the most? Sorting features by \(\|\Delta h\|\) identifies those with the highest change. For a CUT model translating lumbar spine MRI→CT, the top features are primarily textural/gray-level matrix features (GLCM, GLRLM), reflecting the appearance shift from MRI to CT contrast.
2. Is the change concentrated or diffuse? 50% of the cumulative feature change is covered by only 37 out of 464 features, indicating a light-tailed distribution → the translation effect is concentrated in a small number of interpretable features.
3. Which images changed the most or least? Sorting image pairs by their per-image feature change \(\|h_{s \rightarrow t} - h_s\|_2\) reveals that the most-changed images have distinct anatomical differences, while the least-changed images differ mainly in texture and intensity.
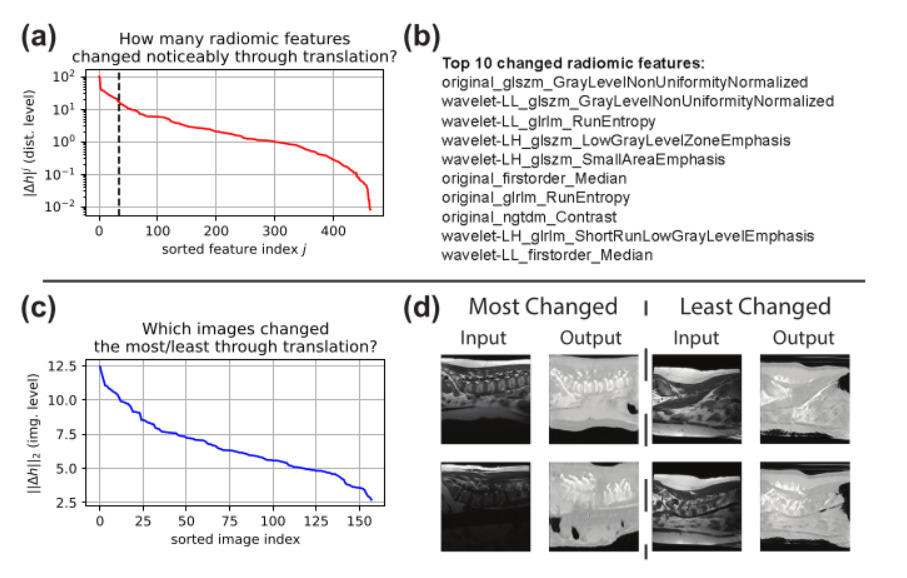
(a) Cumulative feature change — 50% of the change is captured by ~37 features. (b) Top 10 most changed features with interpretable names. (c) Per-image feature change ranking. (d) Most and least changed image pairs.
This methodology can be applied to any two distributions — not just translation — making it valuable for comparing generative models, analyzing domain shift, or auditing dataset quality.
Conclusions
- FRD is a drop-in replacement for FID specifically designed for medical imaging. It uses standardized radiomic features instead of learned ImageNet features.
- Key advantages: (1) interpretable features with clinical meaning, (2) stable at small sample sizes, (3) correlates with downstream task performance, (4) aligns with radiologist perception of quality, (5) sensitive to corruptions and adversarial attacks.
- Limitations: currently designed for 2D image slices (not 3D volumes), limited to radiology (other modalities like histopathology would need adapted features), and absolute FRD values are only meaningful for relative comparisons on the same dataset.
References
-
Heusel, M., Ramsauer, H., Unterthiner, T., Nessler, B., Hochreiter, S., 2017. GANs trained by a two time-scale update rule converge to a local nash equilibrium. NeurIPS 2017. ↩ ↩2
-
Fréchet, M., 1957. Sur la distance de deux lois de probabilité. Annales de l’ISUP, pages 183–198. ↩
-
Bińkowski, M., Sutherland, D.J., Arbel, M., Gretton, A., 2018. Demystifying MMD GANs. ICLR 2018. ↩
-
Gillies, R.J., Kinahan, P.E., Hricak, H., 2016. Radiomics: images are more than pictures, they are data. Radiology, 278(2):563–577. ↩
-
Lambin, P., et al., 2012. Radiomics: extracting more information from medical images using advanced feature analysis. European Journal of Cancer, 48(4):441–446. ↩